
Helpdesk With E-Commerce Reporting
Performance & Helpdesk Reporting in an Intuitive Dashboard
The Replyco e-commerce helpdesk grants you complete visibility into your support team’s performance, tracking all vital KPIs from a single dashboard.
Start Your 7-Day Free Trial
Replyco Performance Reporting
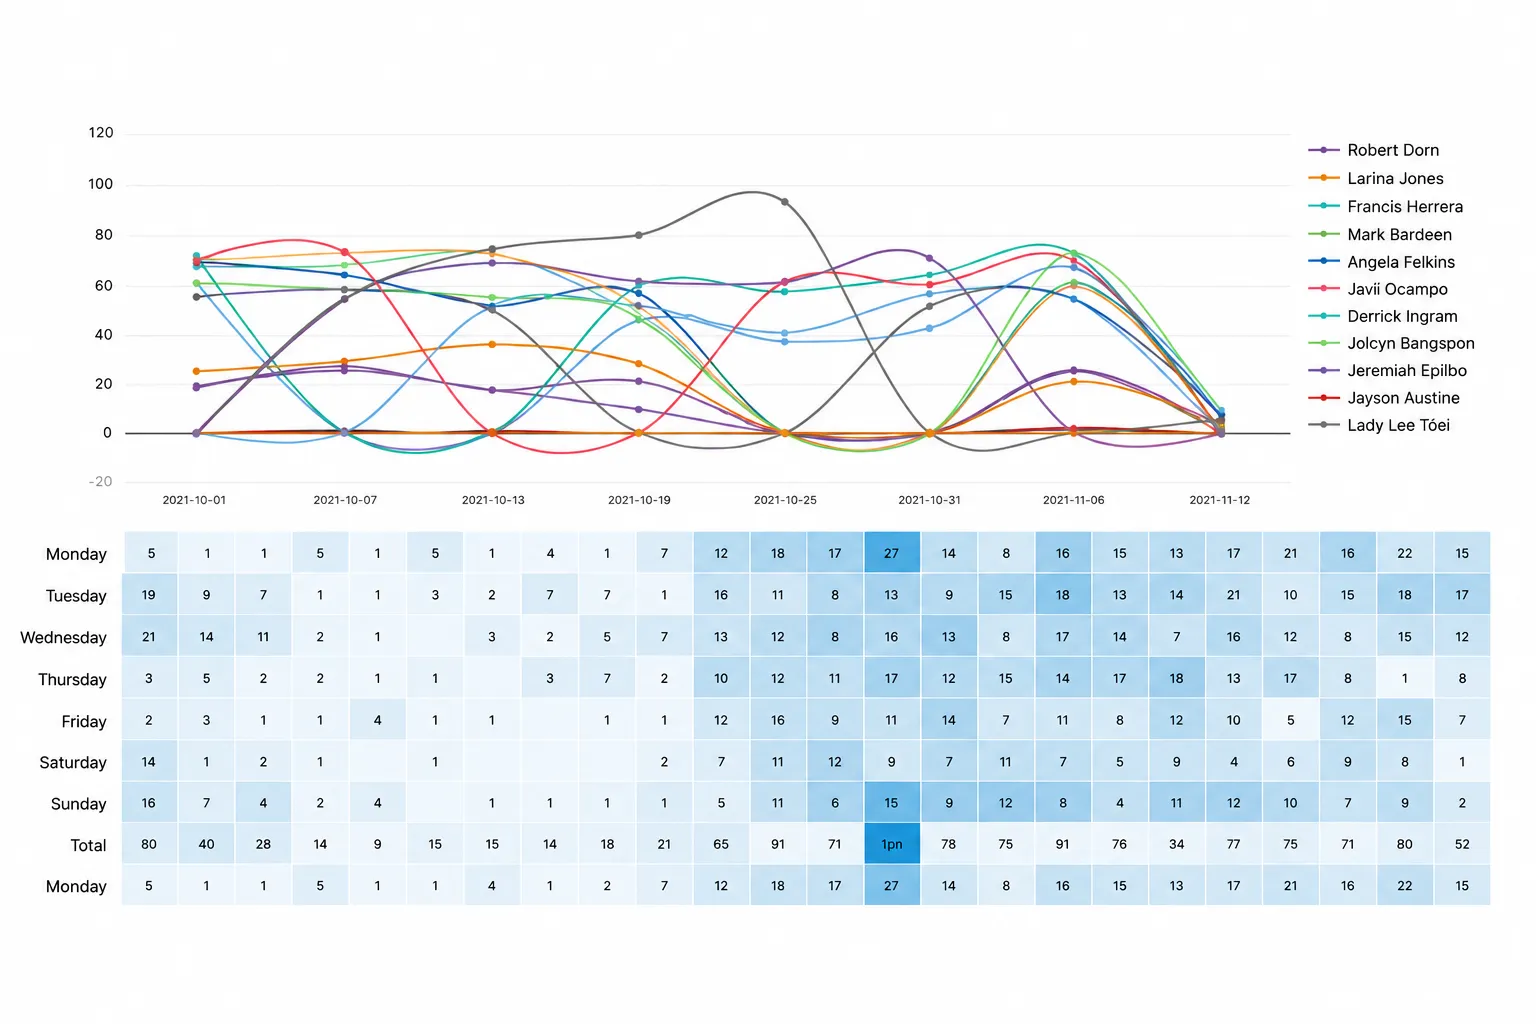
Replyco offers simple, cleanly structured reporting that gives you instant access to your most important metrics and e-commerce data.
Helpdesk KPIs
Team Performance
Frequently Asked Questions
What Is Helpdesk Reporting Used For?

Helpdesk reporting delivers data-driven insights to elevate your customer service. With reporting, you can:
- Boost Team Productivity: See exactly how high the workload is and how efficiently customer inquiries are being resolved.
- Optimize Processes: Bottlenecks (e.g., in response times) become instantly visible, allowing you to fine-tune workflows or SLAs.
- Better Resource Planning: By analyzing peak times (when do most messages arrive?), you can optimize your team's scheduling.
Which KPIs Can I See in the Helpdesk Dashboard?
The dashboard is divided into several sections where you will find the following key performance indicators (KPIs):
- Ticket Count & Status: Number of created, new, unresolved, and resolved tickets (which can also be broken down by hours, days, or months).
- Response & Resolution Times: The average time to first reply (Average Response Time) and until the final closing of the ticket (Average Resolution Time).
- SLA Compliance: Number of tickets that are within agreed service level agreements (SLA) or have already breached them (Overdue SLA).
- Agent Performance: Ticket count and status breakdown, segmented by individual team members.
- E-Commerce Metrics: Reports on which marketplaces or products are generating the most support inquiries.
How Do I Customize My Helpdesk Dashboard in Replyco?
You can flexibly tailor the helpdesk dashboard to your specific needs. Rearrange reports or choose exactly which metrics and charts should be displayed or hidden. Individual elements can easily be moved via drag-and-drop to align perfectly with your workflow.
How Can I Filter and Analyze Performance Data?
To ensure you get the exact data you need, Replyco offers robust filtering options:
- By Sales Channel: Isolate performance data for specific marketplaces and shop systems (such as Amazon, eBay or Shopify) to analyze channels independently.
- By Agent: Filter statistics by the entire team or deep-dive into specific team members to view their individual productivity, ticket counts, and status breakdowns.
- By Working Hours: Limit reports to specific shifts, service hours, or custom time frames to accurately measure performance during actual working hours.
- By Tags: Filter your view by tags (e.g., new tickets, within SLA, overdue, unresolved, resolved) to easily get a comprehensive overview.